
Per-run detail
Type, source, status, start, duration, step and tool-call counts, models used, input, output and total tokens, and error details.
Everything an agent or workflow does is recorded as a structured trace — inputs, model calls, outputs, tokens, every tool call, guardrail hits, approvals and errors. One screen answers what ran, what it used, how long it took and whether a person checked it.
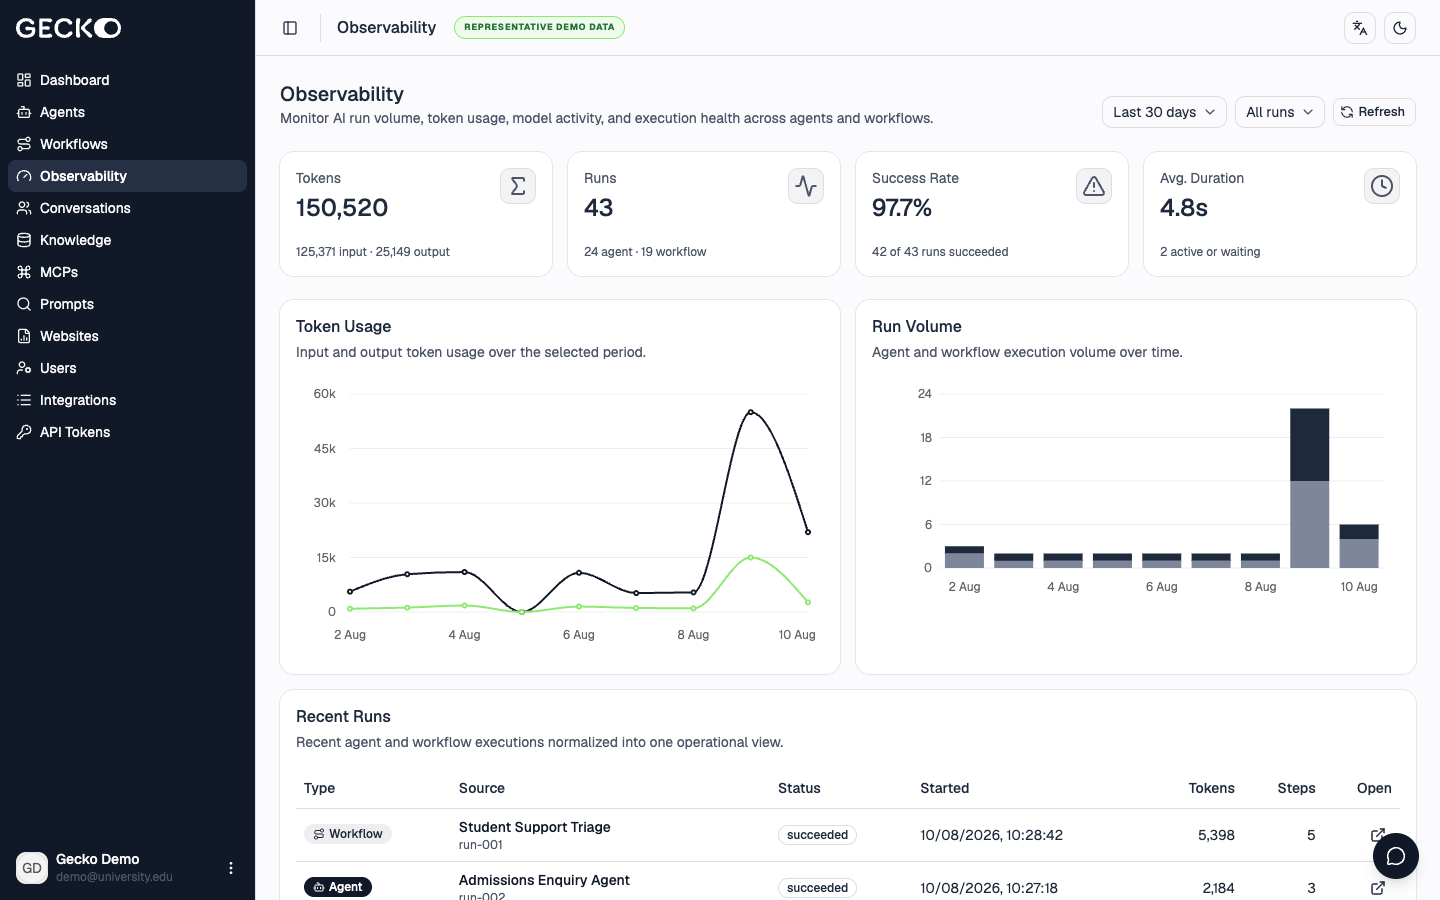
The console opens on a live picture of your AI estate — and the human decisions it’s waiting on.
Agent runs and workflow runs are normalised side by side, so operations, service owners and security all read the same numbers.
| Run | Type | Status | Tokens in / out | Tools | Duration | Guardrail | Review |
|---|---|---|---|---|---|---|---|
| Student support | Agent | Succeeded | 1,284 / 312 | 2 | 2.7s | Redact · PII | — |
| Tuition refund | Workflow | Waiting | 942 / 188 | 1 | — | — | Awaiting |
| IT service desk | Agent | Succeeded | 806 / 94 | 0 | 1.4s | Flag · injection | — |
| Admissions follow-up | Workflow | Succeeded | 2,110 / 540 | 3 | 41m | — | Approved |
Type, source, status, start, duration, step and tool-call counts, models used, input, output and total tokens, and error details.
Filter by time range, run type, agent or workflow, status, errors, guardrail triggered and human approval state.
Review state and review duration on every run, average human review time in the summary — and rejections aren’t counted as errors.
Open any run to see its chronological event trace. For website search, the trace shows the exact search terms, every result with its relevance score, the thresholds applied and a link to the source page.
Every conversation, from every channel, is a full transcript with its runs attached. Guardrail hits flag conversations for review automatically, so risk surfaces without anyone reading every chat.
Knowledge items and every crawled page carry a use count and last-used date. See which pages power answers — and which content nobody has ever needed.
Knowledge & retrievalStart with a bounded outcome and baseline today’s service. The platform supplies the operational evidence; you combine it with enquiry volumes, handling time and cost data.
Measure today’s volumes, response times and handling effort for one process.
Put a governed agent or workflow into production on that process.
Track runs, success, duration, tokens, tool calls and human review time.
Pull run data through the API into the reporting tools you already trust.
Run traces cover what the AI did. The audit log covers what people changed — every create, update and delete, by user or API key.
Audit logsRun, conversation and dashboard data is available through the same REST API and SDK the console uses — ready for your own reporting.
DevelopersFrom a student’s chat message to the exact page and relevance score behind the answer — in three clicks.
We’ll help you pick the first outcome to measure and show you the evidence the platform produces for it.